
by Dan Blewett
How much does a wind turbine cost in 2026, and is it worth it?
While that’s a straightforward question, the answers are long and involved. This article answers as clearly as possible while addressing the many business, technology, and geo-political factors that contribute to an accurate answer.
Because answering ‘how much does a wind turbine cost,’ depends greatly on where the turbine is located, for this article, we’ve drawn the latest data from the worldwide wind industry, but written primarily from a U.S. perspective.
For regular updates on wind turbine costs and the technology, people and policies driving the industry, follow the Uptime Wind Energy Podcast and subscribe to Uptime Tech News.

Header image credit: GE Vernova
Wind Turbine Costs, Returns, and Profitability Forecast: 2026 Industry Update
Onshore Wind Turbine Installed Costs 2025-26
Total installed costs for utility-scale onshore wind have continued to decline, but they are beginning to stabilize as supply chain and labor dynamics evolve.
According to the latest data from the International Renewable Energy Agency (IRENA), the global weighted average total installed cost of onshore projects ranged from approximately USD 727 – 2,110 per kW for 2024-commissioned assets, with a global average around USD 1,041 / kW. Based on current deployment trends, IRENA’s projections indicate onshore wind installed costs stabilizing between about USD 850 – 1,000 / kW by 2026.
At the turbine equipment level, broader industry cost guides indicate commercial onshore turbine units typically cost between USD 2.6 – 4 million per machine, roughly translating to USD 1.0 – 1.25 million per MW of rated capacity for 2–3 MW class machines. Balance-of-plant and installation add materially to these figures. (SolarTech)
Offshore Wind Cost Dynamics 2025-2026
Unsurprisingly, offshore wind development is substantially more expensive than onshore development. Even as rapidly-advancing technology is driving down costs in many offshore-specific applications, the complex offshore environment will almost certainly demand higher capital investment than onshore wind development. Because of the potential for greater energy production, however, the return on investment can be similar to (or better than) onshore wind.
In an offshore development, total installed project costs, including foundations, subsea cables, and grid connection infrastructure, commonly exceed USD 3,500 – 4,000 / kW installed in many markets, according to SolarTech.
Typical turbine unit prices for the largest 12 – 20 MW offshore platforms are in the USD 12 – 20 million range per turbine.
Recent industry analyses forecast the global offshore wind market size exceeding USD 62 billion in 2026, with strong compound annual growth rates into the next decade, underscoring continued developer and OEM investment despite high upfront capital. (Research Nester)
Small and Distributed Wind Turbines
Smaller turbines (sub-100 kW) retain a much higher installed cost per unit of capacity than utility-scale systems, commonly exceeding USD 7,000 / kW installed. These assets are niche-oriented and not typically cost-competitive for grid-scale energy production absent specific off-grid or hybrid use cases. (SolarTech)
The Economics Behind Wind Energy and wind Turbine Costs
A reasonable counter question to ‘how much does a wind turbine cost?’ is, how well do you understand the levelized cost of energy? Here’s some background from an economic perspective.
Levelized Cost of Energy (LCOE)
Wind power’s competitiveness is most directly reflected in levelized cost metrics. IRENA reports confirm that onshore wind remains among the lowest-cost sources of new electricity globally, with a global average LCOE near USD 0.034/kWh (~USD 34/MWh) for newly commissioned plants, making wind more cost-effective than most new fossil fuel alternatives in most markets. (IRENA)
Looking a little deeper, you’ll see that LCOE ranges vary significantly, with the differences primarily driven by resource quality, financing costs, and grid integration. Some industry research reports LCOE ranges from roughly USD 27 – 86/MWh for onshore wind and USD 70 – 157/MWh for offshore wind, particularly when system integration or storage costs are included. (J.S. Held)
Operational Expenditures (OPEX)
Operational and maintenance (O&M) expenditure trends remain a key focus for profitability.
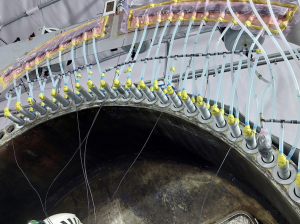
A PRACTICAL GUIDE FOR OPERATORS: Focus on these practical steps to reduce lightning damage & recover damages faster
Commercial onshore turbines typically incur scheduled maintenance in the range of USD 42,000-48,000 per unit annually, with unscheduled repairs and major component replacements adding to lifecycle costs. (SolarTech) Offshore O&M costs are materially higher due to logistics, vessel support, and environmental risk premiums.
Contract Structures affect Wind Turbine Costs and Payback Periods
In established European and North American markets, standard onshore wind projects are expected to deliver a 5–10% return on investment, with construction costs typically paid back within 8–12 years, based on standard power prices and contracts. Under more favorable business conditions, payback periods trend toward the low end of that range. (Source: delfos.energy)
But long-term profitability is fundamentally tied to energy pricing structures which differ significantly from country to country. In recent years, profitability increasingly depends on contract design. In other words, how a producer sells power directly affects revenue.
Most developers – and those in the U.S., almost exclusively – must establish power purchase agreements (PPAs) or corporate deals long before the first turbines are installed. In mature markets, signing long-term, fixed-price deals is still the best way to secure financing and keep capital costs down, which is essential for cash flow and remaining profitable.
In most wind energy markets, in addition to the direct sale of energy to consumers, other revenue streams are available to developers. Those include renewable energy certificates (RECs), capacity payments, and ancillary services markets that provide incremental value, particularly where wind assets actively participate in grid support services.
Are Wind Turbine Costs Going Down?
The short answer is “yes.”
Globally, the cost of wind energy production has gone down due to technology innovations, in every area of the industry, both onshore and offshore.
According to data from IRENA, wind turbine costs (installed basis) have declined significantly, with onshore specific capital investment nearly halved since 2010 and LCOE has dropped at a similar rate. IRENA’s historic analysis shows onshore wind installed costs dropped from over USD 2,200 / kW in 2010 to around USD 1,041 / kW in 2024.
Even as wind turbines have scaled up in size, increasing costs for new designs, additional materials and more complicated installations, technology advances have delivered cost reductions. The largest cost-savings can be attributed to aerodynamic improvements, advanced control systems, and improving capacity factors that are reducing per-unit energy costs. Accio notes that improved forecasting and AI-enabled maintenance strategies are also contributing to lower lifecycle O&M cost trends.
Geographic Market Variance: The China Factor
China continues to dominate in wind manufacturing and deployment, and so it accounts for a large share of global wind additions. China typically reports among the lowest installed cost benchmarks.
Comparing wind turbine costs in China with those manufactured and installed in other countries is difficult, however, because the Chinese government subsidizes energy costs in a wide variety of ways, from the cost of materials and labor to reducing energy rates paid by consumers.
Other high-growth regions, like India and Vietnam, also show lower costs for wind turbines and energy in general due to strong government support and supply chain localization, which results in lower reported costs. (Source: SolarQuarter)

The initial cost of wind turbines is high; wind farm investments recouped over a long period of time.
Challenges and Investments in Wind Energy Deployments
Despite less-than-robust financing conditions for wind developments in certain markets, total global wind installations remain robust. In 2024, renewables deployment reached record addition levels globally, with wind contributing more than 110 GW of new capacity, a significant milestone.
IRENA reports that renewables additions are expanding nearly 20 percent year-over-year, signaling persistent investor confidence in longer-term economics. And according to Research Nester, while the offshore wind market will continue to require high initial capital expenditures (capex) – which means financing factors are critical – the offshore segment is forecast to grow through the mid 2030s, with continued technology improvements bringing increased volume and production efficiencies, and therefore, more profits.
Challenges Impacting Costs and Profitability
Supply Chain and Policy Risks
Near-term volatility in major input costs (steel, rare-earth components), interconnection backlogs, and permitting delays are cited by industry stakeholders as upward pressures on delivered plant costs in several regions. (Accio)
Policy and incentive shifts (such as tax and subsidy frameworks) significantly affect the viability of wind projects. Regions that recently enhanced support for the energy transition – such as increased offshore wind incentives in the UK and throughout Europe – will see the most wind growth and likely, long term profitability. (Reuters)
Even though the Biden-era Production Tax Credit (PTC) is no longer available in the U.S., for owners of aging onshore wind assets, repowering increasingly offers capital efficiency, faster time to revenue, and lower risk compared to greenfield development—particularly where grid access and permitting are constrained.
Market Dynamics in 2025/26
Some markets reported a slowdown in turbine orders in 2025 and auction results underperformed expectations, with the poorer performances attributed to rising costs and market uncertainty. However, analysts expect a modest rebound in deployment and cost rationalization in 2026, driven by adjusted incentives and continuing demand growth for renewable power. (windsystemsmag.com)
Conclusion
As of 2026, wind power remains a globally competitive and cost-effective form of utility-scale power, with significant reductions in cost and continued deployment growth over the last decade.
Onshore wind’s low LCOE relative to fossil fuels underscores its value proposition, and as technology continues to support offshore wind growth, analysts expect to see decreasing costs and long-term profitability. However, in the short term, due to investment and geopolitical risks, developers must have a greater focus on strategic project structuring and operational excellence in order to achieve targeted ROI and profitability.
In short, “how much does a wind turbine cost” is not an easy question to answer. But the answer to the question, “is it worth it” is pretty clear: as the costs of fossil fuels increase and availability lags, wind energy offers the most efficient and cost-effective path to developing new sources of energy.
Interested in Wind Energy? Check out the uptime Wind Energy Podcast
Listen to Uptime on Any Podcast Platform
Wind Turbine Maintenance Costs

A wind turbine study using German data showed that these costs can be 1-2 Eurocents per kilowatt hour (kWh) produced, on average.

How Operation & Maintenance Requirements Impact Wind Turbine Cost
How Much Electricity Does a Wind Turbine Produce?

Wind turbines are sized in megawatts (MW), which refers to their capacity to create electricity.

At full wind speed, a turbine can produce at it’s full capacity. If a turbine is rated for 2.5 MW, then at peak wind speed it will crank out 2.5 MW of power.

Remember that a wind turbine has a maximum rated capacity (such as 4 megawatts), but it produces electricity at a “capacity factor” or “load factor” that is a percentage of this maximum. Because even in dependably windy sits, the wind dies down and changes direction, so overall averages for wind energy production are much lower than the turbine is rated. The actual generation is usually in the 30-40% range for onshore wind turbines and up to 65% (occasionally higher in rare circumstances) for offshore turbines.
If you’re curious how offshore turbines stay upright in the crazy waves and wind out to sea, check out this article featuring some great illustrations.
Need Lightning Protection For Your Wind Turbine?
More Wind Turbine Questions & Answers
If you have a question, please leave it below and we’ll update this article with our answer!

Chart copyright 2024 WeatherGuard Lightning Tech
- Original article by Dan Blewett published December 20, 2021. Edited by Dan Blewett and Diane Stresing. The most recent and substantive changes since original publication date are noted below.
- This article was published on February 19 2026. This article is updated periodically and substantive changes will be noted here.
- Articles related to the wind industry and manufacturing and technology advances are published regularly here and on the Uptime Substack blog, here.